
Small. Fast. Reliable.
Choose any three.
Choose any three.
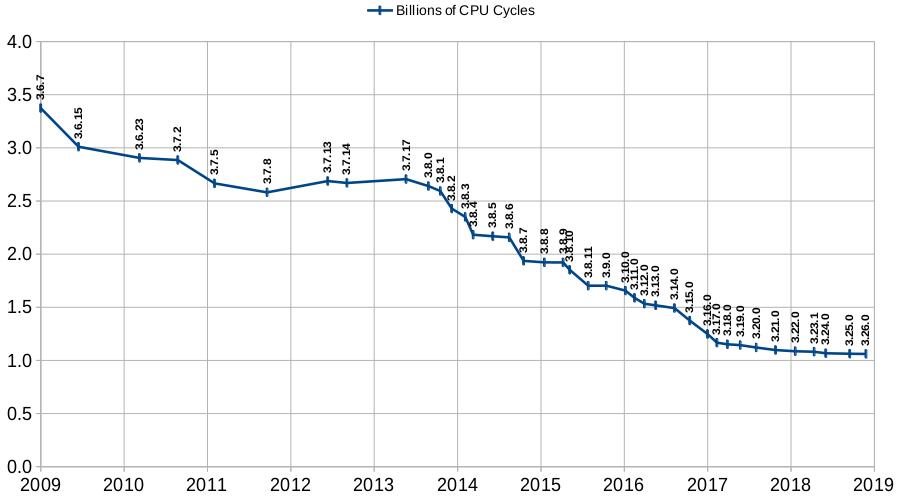
The graph below shows the number of CPU cycles used by SQLite on a standard workload, for versions of SQLite going back about 10 years. Recent versions of SQLite use about one third as many CPU cycles compared to older versions.
This article describes how the SQLite developers measure CPU usage, what those measurements actually mean, and the techniques used by SQLite developers on their continuing quest to further reduce the CPU usage of the SQLite library.
In brief, the CPU performance of SQLite is measured as follows:
For performance measurement, SQLite is compiled in approximately the same way as it would be for use in production systems. The compile-time configuration is "approximate" in the sense that every production use of SQLite is different. Compile-time options used by one system are not necessarily the same as those used by others. The key point is that options that significantly impact the generated machine code are avoided. For example, the -DSQLITE_DEBUG option is omitted because that option inserts thousands of assert() statements in the middle of performance critical sections of the SQLite library. The -pg option (on GCC) is omitted because it causes the compiler to emit extra probabilistic performance measuring code which interferes with actual performance measurements.
For performance measurements, the -Os option is used (optimize for size) rather than -O2 because the -O2 option creates so much code movement that it is difficult to associate specific CPU instructions to C source code lines.
The "typical" workload is generated by the speedtest1.c program in the canonical SQLite source tree. This program strives to exercise the SQLite library in a way that is typical of real-world applications. Of course, every application is different, and so no test program can exactly mirror the behavior of all applications.
The speedtest1.c program is updated from time to time as the SQLite developers' understanding of what constitutes "typical" usage evolves.
The speed-check.sh shell script, also in the canonical source tree, is used to run the speedtest1.c program. To replicate the performance measurements, collect the following files into a single directory:
Then run "sh speed-check.sh trunk".
Cachegrind is used to measure performance because it gives answers that are repeatable to 7 or more significant digits. In comparison, actual (wall-clock) run times are scarcely repeatable beyond one significant digit.
The high repeatability of cachegrind allows the SQLite developers to implement and measure "microoptimizations". A microoptimization is a change to the code that results in a very small performance increase. Typical micro-optimizations reduce the number of CPU cycles by 0.1% or 0.05% or even less. Such improvements are impossible to measure with real-world timings. But hundreds or thousands of microoptimizations add up, resulting in measurable real-world performance gains.
As SQLite developers edit the SQLite source code, they run the speed-check.sh shell script to track the performance impact of changes. This script compiles the speedtest1.c program, runs it under cachegrind, processes the cachegrind output using the cg_anno.tcl TCL script, then saves the results in a series of text files. Typical output from the speed-check.sh script looks like this:
==8683==
==8683== I   refs:      1,060,925,768
==8683== I1  misses:       23,731,246
==8683== LLi misses:            5,176
==8683== I1  miss rate:          2.24%
==8683== LLi miss rate:          0.00%
==8683==
==8683== D   refs:        557,686,925  (361,828,925 rd   + 195,858,000 wr)
==8683== D1  misses:        5,067,063  (  3,544,278 rd   +   1,522,785 wr)
==8683== LLd misses:           57,958  (     16,067 rd   +      41,891 wr)
==8683== D1  miss rate:           0.9% (        1.0%     +         0.8%  )
==8683== LLd miss rate:           0.0% (        0.0%     +         0.0%  )
==8683==
==8683== LL refs:          28,798,309  ( 27,275,524 rd   +   1,522,785 wr)
==8683== LL misses:            63,134  (     21,243 rd   +      41,891 wr)
==8683== LL miss rate:            0.0% (        0.0%     +         0.0%  )
   text	   data	    bss	    dec	    hex	filename
 523044	   8240	   1976	 533260	  8230c	sqlite3.o
 220507 1007870 7769352 sqlite3.c
The important parts of the output (the parts that the developers pay the most attention to) are shown in red. Basically, the developers want to know the size of the compiled SQLite library and how many CPU cycles were needed to run the performance test.
The output from the cg_anno.tcl script shows the number of CPU cycles spent on each line of code. The report is approximately 80,000 lines long. The following is a brief snippet taken from the middle of the report to show what it looks like:
         .  SQLITE_PRIVATE int sqlite3BtreeNext(BtCursor *pCur, int *pRes){
         .    MemPage *pPage;
         .    assert( cursorOwnsBtShared(pCur) );
         .    assert( pRes!=0 );
         .    assert( *pRes==0 || *pRes==1 );
         .    assert( pCur->skipNext==0 || pCur->eState!=CURSOR_VALID );
   369,648    pCur->info.nSize = 0;
   369,648    pCur->curFlags &= ~(BTCF_ValidNKey|BTCF_ValidOvfl);
   369,648    *pRes = 0;
   739,296    if( pCur->eState!=CURSOR_VALID ) return btreeNext(pCur, pRes);
 1,473,580    pPage = pCur->apPage[pCur->iPage];
 1,841,975    if( (++pCur->aiIdx[pCur->iPage])>=pPage->nCell ){
     4,340      pCur->aiIdx[pCur->iPage]--;
     5,593      return btreeNext(pCur, pRes);
         .    }
   728,110    if( pPage->leaf ){
         .      return SQLITE_OK;
         .    }else{
     3,117      return moveToLeftmost(pCur);
         .    }
   721,876  }
The numbers on the left are the CPU cycle counts for that line of code, of course.
The cg_anno.tcl script removes extraneous details from the default cachegrind annotation output so that before-and-after reports can be compared using a side-by-side diff to view specific details of how a micro-optimization attempt affected performance.
The use of the standardized speedtest1.c workload and cachegrind has enabled significant performance improvement. However, it is important to recognize the limitations of this approach:
Performance measurements are done with a single compiler (gcc 5.4.0), optimization setting (-Os), and on a single platform (Ubuntu 16.04 LTS on x64). The performance of other compilers and processors may vary.
The speedtest1.c workload that is being measured tries to be representative of a wide range of typical uses of SQLite. But every application is different. The speedtest1.c workload might not be a good proxy for the kinds of activities performed by some applications. The SQLite developers are constantly working to improve the speedtest1.c program, to make it a better proxy for actual SQLite usage. Community feedback is welcomed.
The cycle counts provided by cachegrind are a good proxy for actual performance, but they are not 100% accurate.
Only CPU cycle counts are being measured here. CPU cycle counts are a good proxy for energy consumption, but do not necessary correlate well with real-world timings. Time spent doing I/O is not reflected in the CPU cycle counts, and I/O time predominates in many SQLite usage scenarios.
This page last modified on 2025-05-31 13:08:22 UTC